Evaluative thinking with rubber numbers: How economic evaluation can help us understand uncertainty
Not so long ago, Sara Vaca and I collaborated to produce a visual summary of economic methods of evaluation. We used the example of a cycling superhighway to illustrate how we can use economic evaluation to produce various indicators of ‘outcome efficiency’.
For example, cost-benefit analysis (CBA) uses monetary valuation to compare costs (value consumed) with benefits (value created). If our cycling superhighway costs $66.7m to build and produces benefits such as time savings, reduced carbon emissions, reduced road crashes, and improved quality of life to a total value of $175m, then we can say the investment has a net present value of $108.3m – a positive result because benefits are greater than costs.

Economic methods of evaluation are often used to produce ‘point estimates’ like this. A point estimate (a single number) can sound very authoritative and certain. But really, it depends on all sorts of assumptions we made when we were doing the analysis. For example, international research suggested how many drivers might switch from driving to cycling, but we don’t really know what will happen in our context.
It might be more honest to say, ”we’re not exactly sure how much value this project could create, but based on similar projects, somewhere in the vicinity of $108 million seems believable”.
In the face of this uncertainty, economic analysis is sometimes criticised for working with ‘rubber numbers‘ – and indeed, there’s a risk the input variables could be ‘stretched’ to support a predetermined conclusion, rather than a hard-nosed appraisal of whether the investment is likely to be worthwhile.
However, there are sound ways CBA can help to clarify the implications of uncertainty and support better decision making. Three tricks for analysing uncertainty are sensitivity analysis, scenario analysis, and break-even analysis. Applying these techniques can help us think evaluatively about our options and whether a project is worth investing in.
Sensitivity analysis tests each assumption, one by one, to see how sensitive the overall result is to changes in the assumptions. To illustrate, we can say things like, ”reducing the assumed number of cycling superhighway users by 20% reduces the NPV by 17%”.
Sometimes, a small change in a variable can have a big impact on the result. Other times, a large change in a variable can have negligible impact on the result. Either way, it’s useful to know.
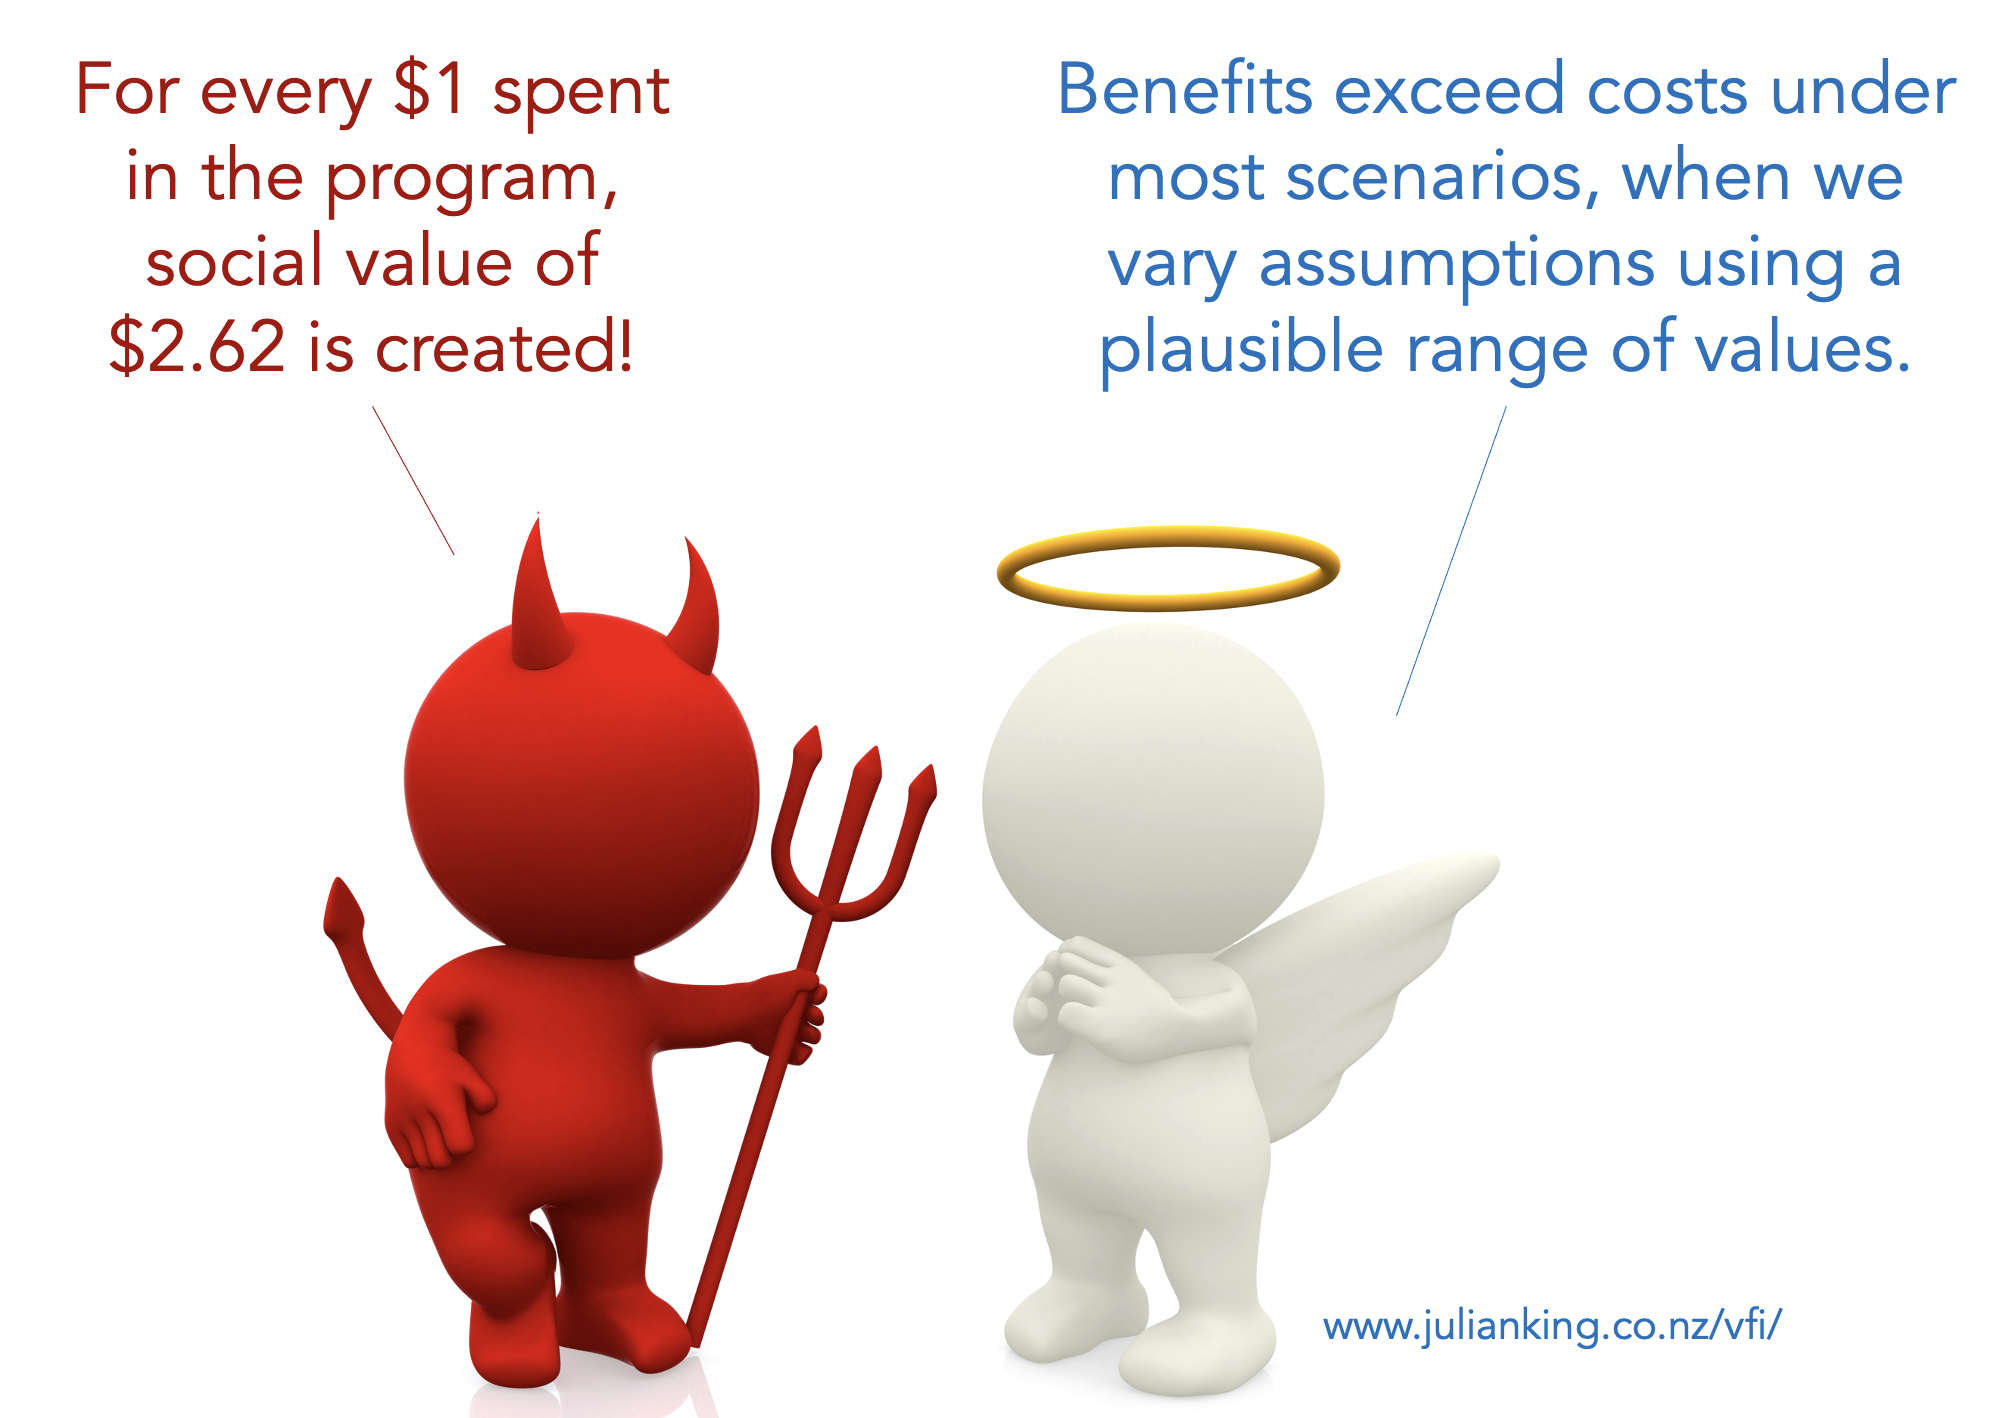
Scenario analysis takes a ‘what-if’ approach, changing combinations of assumptions, for a range of optimistic and pessimistic scenarios, to see how the result is affected. For example, as well as not knowing the exact number of people who switch to cycling, we’re not completely certain to what extent the cycling superhighway will reduce road congestion, travel times, emissions, injuries and deaths. We don’t know exactly how these effects will play out, but from literature we have some idea of the plausible range of results.
If we vary all of these assumptions at once, we find the NPV is likely to be somewhere between an optimistic value of $268 million and a pessimistic value of -$12 million. Under the most pessimistic scenarios, the project might not be worthwhile.
We can go a step further if we know or estimate probability distributions for the uncertain variables – e.g. perhaps the proportion of drivers who switch to cycling is normally distributed, with a mean of 10% and a standard deviation of 3%.
Then we can get a computer to run a Monte Carlo simulation – say 1,000 scenarios, changing all the input variables each time according to their probability distributions. Then we can say things like “959 out of 1,000 scenarios had a positive NPV”. This is reassuring because it tells us our project will very probably be worthwhile.
Break-even analysis is when we run sensitivity and scenario analysis backwards. We ask, what’s the minimum effect needed for benefits to just equal costs? (In Excel, you can do this using the ‘goal seek’ function). Then we can say things like, ”we get a positive NPV as long as 3.8% of drivers switch to cycling”. This is useful because it tells us the performance threshold we need to meet. Even in the face of uncertainty, break-even analysis can help us make a sound judgement about the prospects of a project breaking even.
It is often more honest, more useful and more valid to include the results of scenario, sensitivity and break-even analysis rather than just giving the point estimate.
Click through to Part 2: break-even analysis and rubrics
December, 2020 / Updated May, 2021