Evaluative thinking with rubber numbers Part 2: Break-even analysis and rubrics
I’ve written before about how cost-benefit analysis (CBA) should be transparent about uncertainty, and how a good CBA can actually help enlighten us about the implications of uncertainty for the potential value of a program or policy.
Sometimes when we’re missing some data, we can gain important insights by doing a CBA that plays with uncertain input variables, turning them up and down to understand how they affect the range of possible results.
When there’s a lot of uncertainty, we can often still make a well-informed judgment about the prospect of an investment breaking even – i.e. creating enough value to justify the resources it consumes.
For example, say you have a pretty clear idea of the costs of delivering an intervention, but it’s too soon to measure its benefits. Perhaps we can model the value of ‘one outcome’ (e.g. one person experiencing the intended benefits of the program). We can estimate what a low, medium, and high value could be for that outcome. Then we can work out how many people would have to benefit in order for the program to break even on its costs.
So, if the program costs $1m per year, and lifetime benefits are estimated to have a present value of $20-30,000 per person, then we can expect that somewhere in the range of 33-50 people each year would have to experience the intended outcomes for the program to break even.
That’s a lot quicker than a full CBA, using very limited data – and it could provide us with enough information to support a sound judgement. For example, if the program is working with 10,000 people each year, and we have a survey indicating that more than 50% of them are experiencing some positive changes that they attribute to the program, this would suggest the program has a very good prospect of creating more value than it consumes (even after allowing for some optimism bias, 5,000 people is well ahead of the 50 needed to break even).
You can use a rubric to help judge the break-even potential on a transparent basis. For example, you could rate break-even prospects using a rubric like this:
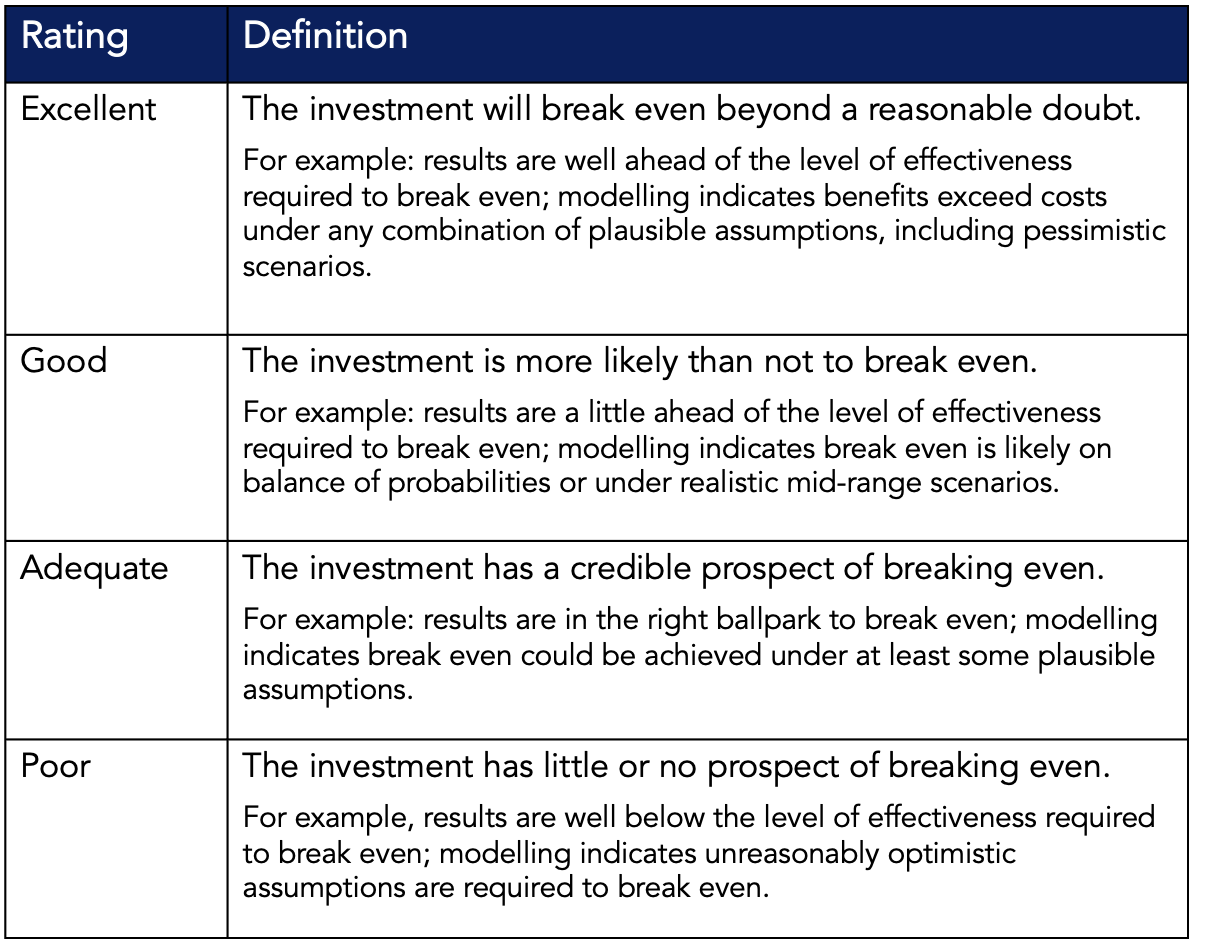
Here are a couple of examples:
King, J., McKegg, K., Arau, A., Schiff, A., Garcia Aisa, M. (2020). Social and Economic Impact Assessment of Mutation Breeding in Crops of the RCA Programme in Asia and the Pacific. International Atomic Energy Agency, Vienna.
Hansford, F., Akkurt, O., King, J., Vanzetti, D., Rasulova, S., Namukasa, E. (2019). Independent Evaluation of TradeMark East Africa Deliverable 6D: Strategy 1 Value for Money Assessment. Oxford Policy Management.
June, 2021 / updated April 2022